Listen and subscribe to Stocks in Translation on Apple Podcasts , Spotify , or wherever you find your favorite podcasts.
Stocks roared last week , with small caps resuming and leading the post-election rally. The poster child of the Trump trade, Tesla ( TSLA ), is up a cool 35% since Election Day, having broken out to a two-year high.
But it's not just the charts; it's the psychology of the patterns the charts form.
Breakouts thrive on emotion — fear and greed — and the unrelenting momentum that fuels both bull and bear markets. Technical patterns don't only measure prices, they measure belief.
Julius de Kempenaer, creator of Relative Rotation Graphs (RRG) , recently joined Yahoo Finance's Stocks in Translation podcast and broke down the ways to play some of these chart patterns.
“You want to jump on something that’s [moving] in the right direction," de Kempenaer said. "So, it has established that strength already, and you want to piggyback on that move."
Here's a look at two bullish charts from one stock currently seeing a breakout.
A technical analysis of Block
Block ( SQ ) — formerly Square — is a prime example of a pandemic-era darling whose stock price got crushed in the wake of an aggressive Federal Reserve interest rate-hiking cycle. Its 800% rally over a year and a half was followed by an 80% plummet going into 2022.
While the "Magnificent Seven" megacap tech stocks and the Nasdaq Composite ( ^IXIC ) soared in 2023 and 2024, Block chopped around in a frustrating consolidation. Recently, however, Block has surged back to life, breaking out of a long-term inverse head-and-shoulders pattern .
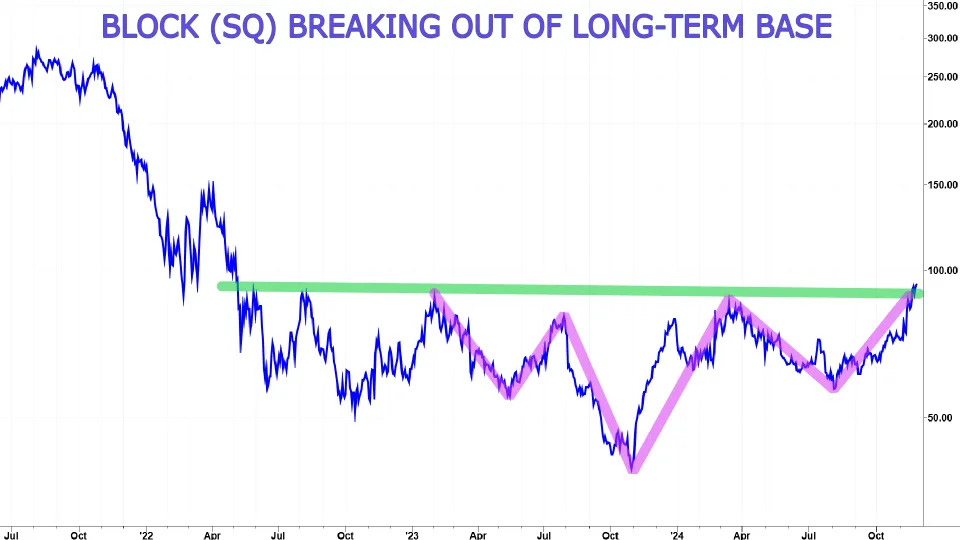
The "inverse" refers to the fact that the pattern (shown above) is the mirror image of a bearish head-and-shoulders top, a pattern consisting of three peaks in which the outer two "shoulders" reach similar levels and the middle peak, or "head," rises to a higher level.
While no pattern is picture-perfect, most technical analysis practitioners would view the left (upside-down) shoulder — the first of three "V" formations — as forming over the first three quarters of 2023. The second dip, the upside-down head, dropped lower than the first, shaking out another wave of investors.
The rightmost shoulder got underway in the second quarter of this year, with the price approximately matching the left shoulder. Critically, over this entire two-year period, Square never closed over the $90 baseline — until last week.
Block's breakout is now triggering a wave of buying, which de Kempenaer explained using market psychology: "The people who sold short are the best drivers of the bull market because when you sold short at that previous high, you are now at a loss. So you need to cover your position."
He added that many professional investors will also buy again to initiate a long position.
"There's a double buy," he said.
Zoom in, and you can see another Block chart pattern forming on a shorter, nine-month time frame.
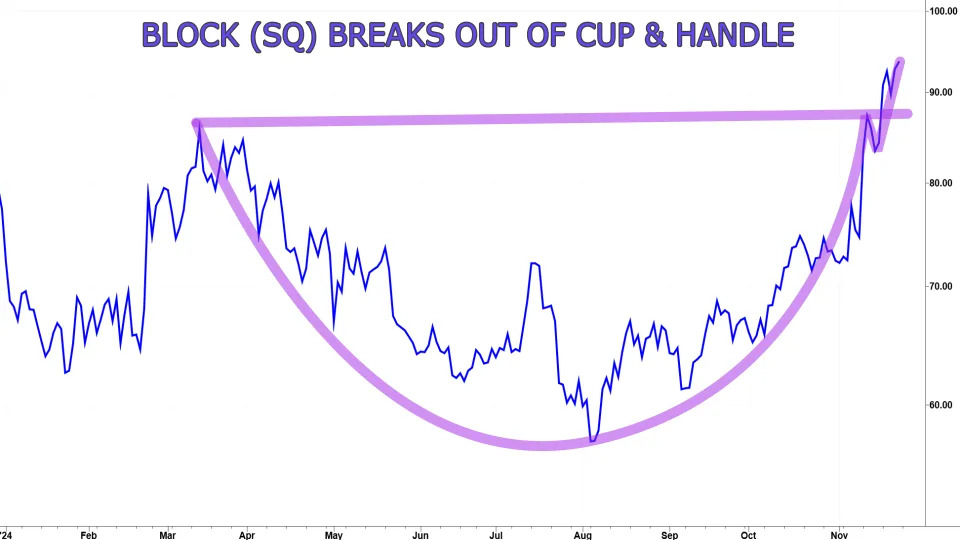
The so-called cup-and-handle pattern is visually simpler than the head-and-shoulders, taking on the form of a gently rounded base that looks like a smile.
At the rightmost side, the handle is formed by a pause and consolidation before breaking out. In the case of Block, this relatively small handle only took about four days to complete.
Where do prices go from here? Many practitioners of the technical analysis dark arts look for the price ranges of stocks to repeat.
Block chopped around for two years in a $50 price range as it was establishing its inverse head-and-shoulder pattern. This points to an upside target of roughly $140 from the $90 breakout level, which would take it to the March 2022 interim high. This represents a 55% gain for someone playing the breakout.
However, given the length of the consolidation, many traders will be holding out for higher levels. As an old and revered technical analysis maxim posits: "The bigger the base, the higher in space."
On Yahoo Finance's podcast Stocks in Translation , Yahoo Finance editor Jared Blikre and producer Sydnee Fried cut through the market mayhem, noisy numbers, and hyperbole to bring you essential conversations and insights from across the investing landscape. Find more episodes on our video hub or watch on your preferred streaming service .