The CCI ‘MoMo' Trade
One of the most common questions that we receive as Trading Educators is: “What indicator should I use?”
Many traders are under the belief that the secret to profits lies in the indicators used. Don't worry – I also harbored that belief when I first found this beautiful art of speculation. Through trials, tribulations, and draw-downs, I learned that indicators were just that – a simple indication. They didn't tell me much more than price already did, and they definitely did not provide a ‘crutch,' on my way to trading profitably. But when used effectively – they can assist me with the factors that I DO have in my control, such as trade, risk, and money management.
CCI, or The Commodity Channel Index, is a fascinating indicator: It was developed in 1980 by Donald Lambert.
I'm personally partial to CCI as I can use the indicator in multiple market conditions. If the market is ranging – I can trade ranges. If the market is trending with a lot of strong momentum (also called ‘MoMo by traders), CCI can help me trigger my entries. The key here is the trader – and the traders' identification of the correct market condition so that CCI can be employed properly.
One of the tenets that we vigorously teach in the + Trading Course is the importance of trading with the Trend. I'm of the belief, as are the rest of the Education group, that while counter-trend trades may potentially work, taking trades in the direction of the trend can be far more amenable to the traders' goals.
Let's take a look at the “CCI Momo,” strategy to get an idea for how some traders approach momentum situations with CCI.
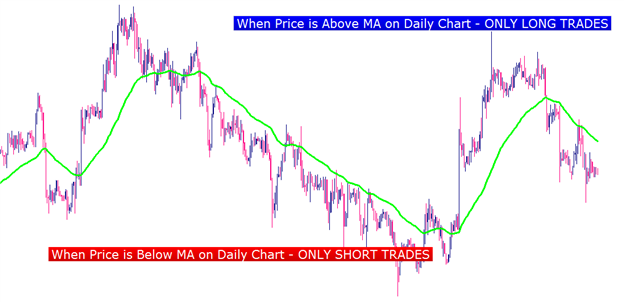
If we pull up a daily chart and add a 55 period Moving Average, we have what can be looked at as a ‘Trend Proxy.'
When price is above the MA on the Daily Chart – I only want to take long trades (indicating that the trend is up), and when price is below the MA (showing me that the trend is down) – I only want short positions.
Created with Marketscope/Trading Station 2
Now that I know what direction I want to trade this situation, I can go down to my shorter time frame chart. If I'm using the Daily for trend analysis, I'm often using the 4 hour for entries. I've included below a brief synopsis of the timeframes I'll employ when using multi-time-frame analysis. If you'd like to find more information, we do a Live Webinar in the + Trading Room once per week on just this topic: Multi-Time-Frame Analysis. If you'd like to view the schedule, as well as our archived sessions (you can locate the previous Multi-Time-Frame Analysis session in the archived video player), please click on the link below:
+ Trading Room
Multi-Time Frame Trend, and Entry Chart Timeframes
| Trend Identification | Entry Chart |
|---|---|
| 1 week | 1 day |
| 1 day | 4 hour |
| 4 hour | 1 hour |
| 1 hour | 15/5 mins |
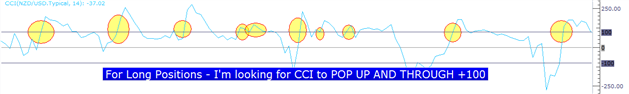
When on the 4 hour chart, this is where I begin analyzing the CCI readings. In the case of long positions, I'm looking for CCI to penetrate the +100 line (please see below):
Created with Marketscope/Trading Station 2
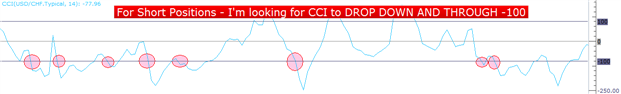
For short positions, I'm looking for the same thing – only reversed. Please see below for a diagram of CCI for short positions:
Created with Marketscope/Trading Station 2
Putting it All Together
Let's look at a full trade setup to get an idea for how the CCI Momo trade would be plotted.
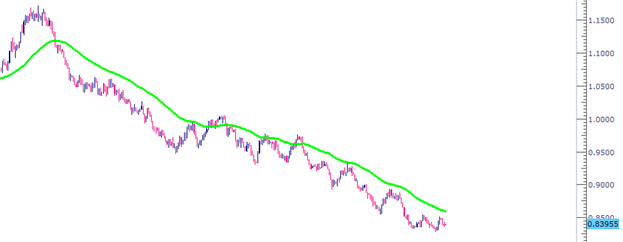
USD/CHF has been in quite the bearish down-trend. From my Daily Chart (below), we can see that ‘Swissie,' has priced down over 2500 pips since June of 2010. Also – key for myself in this strategy – price is trading nicely below the 55 period Exponential Moving Average:
Created with Marketscope/Trading Station 2
In these situations – there is really only one way in which I'm interested in playing this. I only want short positions. Even though the trend *can* or *may* turn around, I don't want to risk my hard-earned money on that potential prospect.
Upon performing my trend analysis, I decide, due to the strong down-trend and the fact that Swissie is below my 55 period EMA, I want to look for short position on the USD / CHF chart. Because I'm using my Daily Chart for trend analysis, I'm going to use my 4 hour chart for entry.
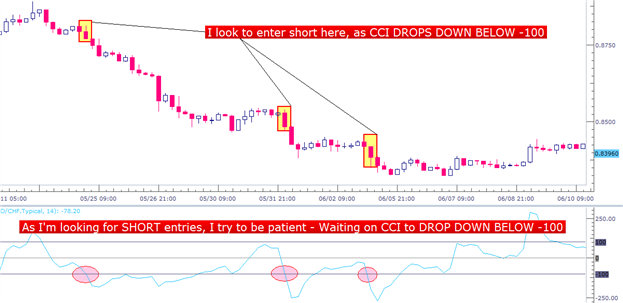
Created with Marketscope/Trading Station 2
Let's take a quick look at a long setup as well:
The NZD/USD currency pair has been on a momentous tear – continuing to make new all time highs. As it continued to climb higher, CCI offered numerous ‘MoMo,' entries (Please see below).
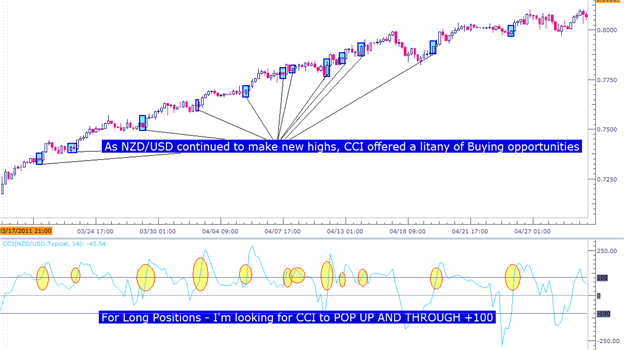
Created with Marketscope/Trading Station 2
This is just one of the many strategies that we talk about in the + Trading Room.
If you haven't joined us in the + Trading room yet, please feel free to come by and see what we offer to all Live FXCM Clients. On top of the + Trading Course, we host live webinars 3-4 times per trading day in which we chart and diagram our trades, and student-traders can ask us questions in real-time about strategies, setups, or current market conditions. You can navigate directly to the + Trading Room from the link below:
+ Trading Room
If you don't yet have a live account with FXCM, you are certainly welcome to request trial access to the + Client Suite that is available to every live FXCM Client. You can request trial access from the following link below (sign-up field located to bottom right corner of page):
+ Trial Access
To join James Stanley's distribution list, please click here.
Thank you very much for your time, and Happy Trading!