In my experience, traders are generally more successful when trading currency pairs between support and resistance in a ranging environment. When looking for a chart today, the ZAR/JPY caught my eye. This pair continues to trade in a distinct range dating back to March 2009. The daily chart below shows clear areas of both support ( 11.25 )and resistance ( 12.50 ) . Once these levels have been established we can zoom in to a shorter time frame to look for entry opportunities.
Price Action
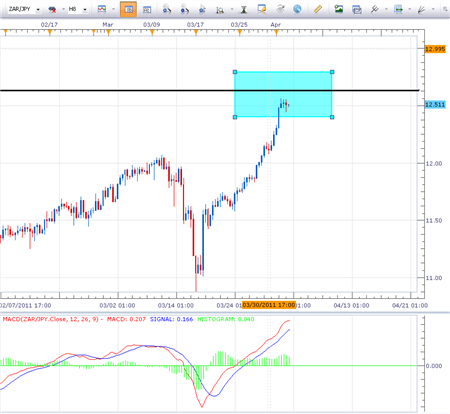
Taking price in to an 8hr chart, we can find resistance again forming near the 12.50 price level. Historically, resistance has been found in a zone between 12.40 – 12.80. MACD is currently above our zero line however, and a fresh cross of our signal line has yet to be established.
Trading O pportunity
As price closes in on resistance I will begin to look at selling opportunities on ZAR/ JPY . My preference is to enter short near 12.50 as close to resistance as possible. I am using the MACD oscillator to confirm my entry and will be looking for a bearish cross above the zero Line for my entry signal. Stops should be placed above resistance at 12.90. Using a 1:2 Risk – Reward ratio, my profit target sites are set on 11.70 or lower for an 80 pip gain.