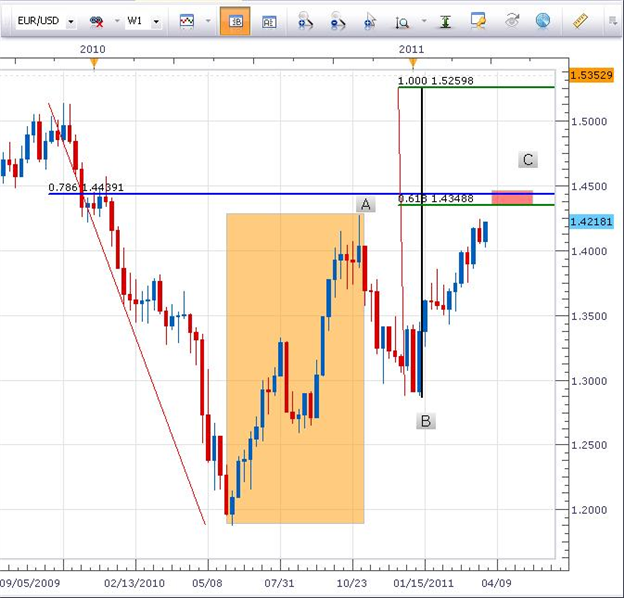
The EURUSD has been on a choppy rise towards the late 2010 highs of 1.4280. It has been choppy for those traders going long because of the occasional sell of spooking them. It has been frustrating for those traders going short because of net progress up the charts, too.
What do the charts say about the price movement?

Let's pick up some clues from the charts. First of all, the blue and gold waves are equal in length. This is a clue that the down move in November & December 2010 is a corrective move that is likely to be completely retraced. This means prices are likely to break above 1.4280.
How high could prices move?

Zooming out to a weekly chart, we are a couple hundred pips away from significant resistance. The 78.6% retracement level is near 1.4440. Additionally, the length of wave C = 0.618 X wave A = 1.4350. If SSI begins to turn net positive on bullish sentiment, then a resumption of the long term bear trend would look enticing. Therefore, a reasonable zone to expect a resumption of the longer term down trend may be 1.4350 – 1.4450.