How Many Candles Should Be Viewed on a Chart
Student's Question: When plotting the lines on a daily chart, how far should I zoom in. Approximately how many candles should I go off of? Instructor's Response: Good question...
A general rule of thumb is that on a Daily chart you should be looking at about one year's worth of trading data. For a 4 hour chart three to four months will suffice and on a 1 hour chart a month would work.As far as candles go, it is recommended that at least 50-75 candles be showing on the chart to obtain a better overview of how the pair has been moving over time.When a trader "expands" a chart and just looks at 15 to 20 candles or less, they are doing themselves a disservice in that they cannot see the big picture and may not be able to see prior support/resistance levelsthat could very well impact their trade.Take a look at these historical chart examples below...
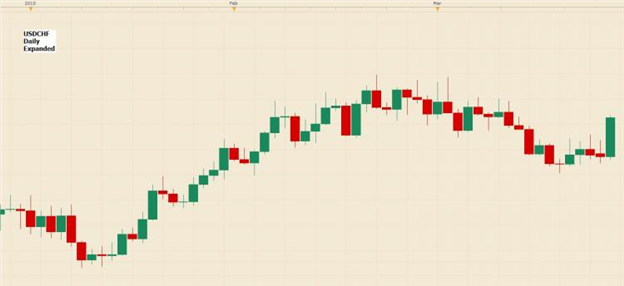
Looking at the chart with about 60 candles on it you can readily see how the full view of the chart provides much better insight for the trader. In this case, the trendline support would clearly play a part in this analysis and it would not even be visible if the trader chose to “expand” the chart.