Student's Question: As you can see, I had some difficulties drawing the trendlines of this historical daily USDJPY one year chart...could you enlighten me on this? Thanks.
Instructor's Response: Based on this historical Daily chart of the USDJPY, the line that would come into play for trading would be the resistance line noted in red on the chart below.
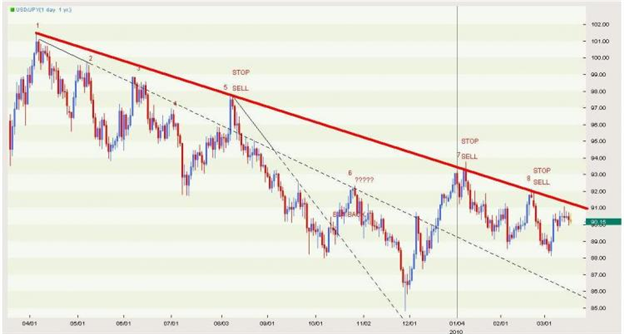
When drawing a trendline in a downtrend, a trader would be looking to connect the high points on the chart to see if in fact a trendline would "fit" the price action. In the case of this USDJPY Daily chart, it does fit quite nicely. We would take care in drawing the trendline so that it does not go through any candle bodies...going through a wick is alright. We look for at least three points where price came in contact with the trendline. That way we can confirm that the trendline is valid.When drawing a trendline in an uptrend, a trader would go through the same process however they would be looking to connect the low points of the move.Since the pair is in a downtrend, ideally the trader would wait for price action to trade up to trendline resistance without closing above it and then shorting the pair with a stop just above the trendline.