Student's Question: Would you or do you use at this time your RSI @14? A post I read mentioned 9 or 25 could a person go somewhere in between, say 18? If day trading would you leave at 14? Or if trend trading go longer? Thanks. Instructor's Response: The default setting used by most traders for the RSI is 14. That means that the indicator will go back 14 periods or time frames based on the chart being used (14 days on a Daily chart, 14 hours on an hourly chart and so forth) and make its calculation based on that.Personally, I believe that particular setting would suffice in the majority of trading scenarios.You asked about using a longer or shorter setting for the indicator...For longer term trading the number might be increased but, as mentioned in the lesson, fewer trading signals will be generated but they will have a greater level of reliability associated with them...the same as using a longer term chart versus a shorter term chart for example. Conversely, if you lessen the number of periods in the equation, more trading signals will be generated but they will have a lower level of reliability...just like using a shorter time frame chart lowers the reliability of the signals it provides.Take a look at the chart below for a visual on this...
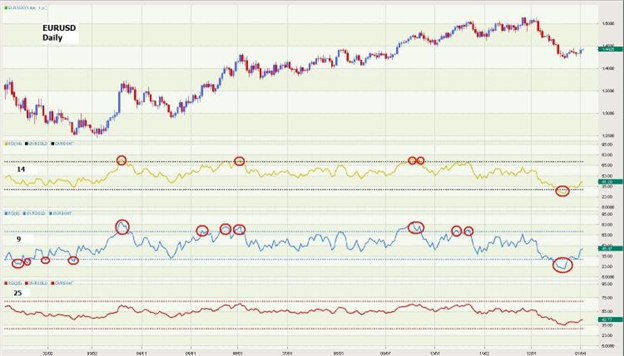
(Just by way of a quick review, the RSI gives a buying signal when the it has been below 30 and then closes above 30. The selling signal is provided from RSI when it has been above 70 and then closes below 70.)The first RSI on the chart below is the standard 14 period version. Based on the above criteria, a buying or selling signal was generated in each of the red circles for a total of 5 signals.On the second version below we have shortened the number of periods to 9. As can be seen, the indicator becomes much more sensitive and the difference in the number of signals generated is readily apparent. The total on this version is 12. If one compares the signals themselves to the price action on the chart, we can see that some of the signals were valid and would have generated pips while others were simply a short lived blip on the chart...a false entry, if you will.The last version of the RSI is set at 25 periods. We can see the smoothing effect that increasing the number of periods has. Also, we note that not one signal is generated during the time frame encompassed by the chart. When a signal does appear, however, it will have greater level of reliability behind it than either the 9 or the 14 period.After all of the above is said, a trader can set the period to whatever they find best serves their trading style and strategy. This can be accomplished through experimentation with various time frames and logging the results. However, the 14 period gets my vote for the trading style employed by the majority of traders.