Student's Question: Was I wrong in thinking that the chart was showing me a double top pattern where line A was the top and line B was the bottom? The last three candles on the chart have not exceeded the previous high, so doesn't that mean that a temporary resistance level has formed? Power Course Instructor's Response: Yes...a temporary resistance level has formed. That does not necessarily mean, however, that the pair will be changing direction in any permanent fashion.
Keep in mind that after price establishes the first top and then retraces, as price re-approaches the level of the first top in every instance it will appear that a double top is forming. More often than not, however, the pair ultimately will continue in the direction of the daily trend.
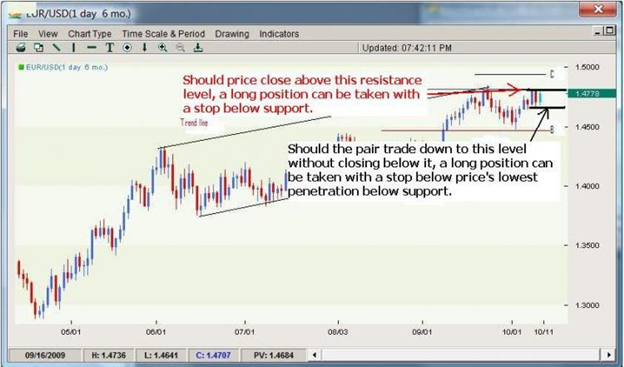
To try to trade "counter trend", is to invite more risk into a trade. The strongest tool that we can use to determine the direction to trade a pair is the Daily trend...all else is secondary.The higher probability trade will always be in the direction of that Daily trend. The greater likelihood of success will be to look for buying opportunities based on how this pair has been moving. Take a look at the historical chart of the EURUSD below for a visual...