
| This Week’s a.i. Stock Spotlight is Root Insurance ($ROOT) |
Root Inc., based in Columbus, Ohio, is revolutionizing the auto insurance market with its innovative technology-driven approach. Founded in 2015, the company leverages smartphone technology and data science to provide personalized auto insurance rates. This model focuses on actual driving behavior, distancing itself from traditional demographic-based insurance pricing, and catering to a tech-savvy demographic looking for fairness and personalization in their insurance policies.
Root Inc. has seen fluctuations in its financial health, characterized by significant challenges in achieving profitability despite increasing revenue streams. The company’s strategic focus on leveraging technology to disrupt the traditional insurance marketplace keeps it relevant and competitive, but the path to sustained profitability remains steep and fraught with challenges.
When we study the revenue and earnings of $ROOT for the past 5 years what is very exciting is that it appears that $ROOT has turned the corner to profitability.
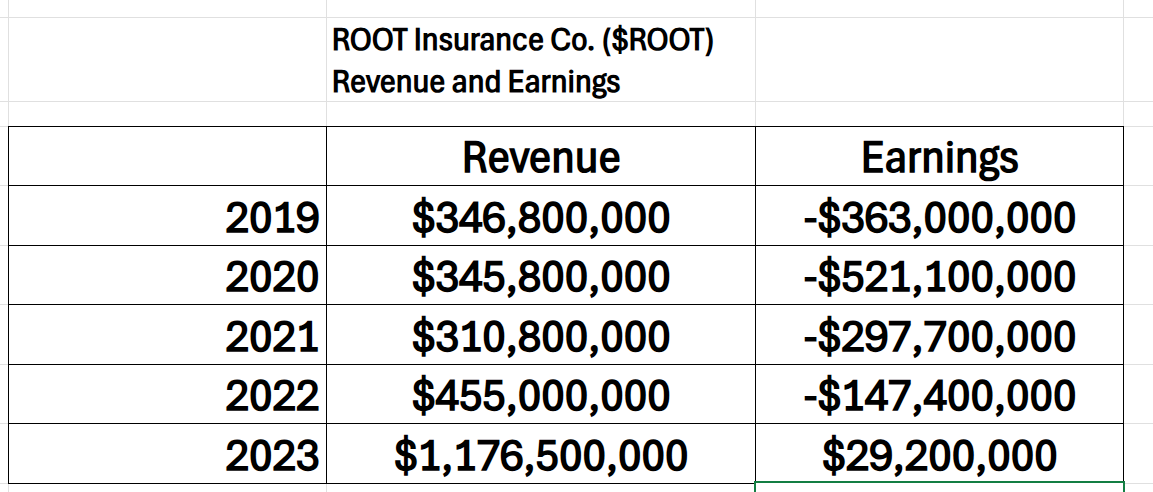
$ROOT has grown revenue 239% over the last five years. During that time frame it lost money every year except for 2024 where it finally turned a profit. Root Inc. currently offers auto insurance in 35 states across the United States, potentially covering 77% of the U.S. population. This expansion reflects the company’s growth in the competitive insurance market and its innovative approach using technology to personalize insurance premiums based on driving behavior.
Root Inc. operates within the Property & Casualty insurance sector, directly competing with larger, established insurance companies as well as other tech-forward entities in the “Insurtech” space. Although smaller in scale compared to industry giants, Root’s unique value proposition lies in its application of telematics to insurance, which not only differentiates it but also positions it for potential growth in an industry ripe for technological disruption.
Root is increasingly focusing on embedded insurance, particularly through strategic partnerships, such as their notable collaboration with Carvana. This partnership integrates insurance directly into the car-buying process, offering personalized rates seamlessly during the vehicle purchase experience. The company uses sophisticated telematics technology not just for tracking driving behavior but also for ongoing data collection post-policy issuance, which continuously informs their pricing models and risk assessments. To date, Root has gathered over 30 billion miles of driving data, which it uses to refine its risk assessment models and pricing strategies significantly.
What also adds sizzle to the $ROOT narrative is that $Root secured a substantial $300 million five-year term loan from BlackRock, highlighting strong financial backing and market confidence in its business model. Having the largest Asset Manager in the world in your funding corner certainly instills a vote of confidence for traders and investors. What also helps the company differentiate itself is its commitment to Fair Pricing. $ROOT stands out by not insuring high-risk drivers, which helps them maintain lower premiums for their target demographic — safer, more conscientious drivers .
The future looks promising for Root with several avenues for growth. The company could expand its innovative insurance offerings into other types of insurance products, further broadening its market reach. The increasing market adoption of telematics and a growing consumer preference for usage-based insurance products provide fertile ground for Root’s expansion strategies. Moreover, technological advancements in its offerings could enhance customer engagement and satisfaction, propelling further growth.
Despite these opportunities, Root faces substantial challenges. The competitive landscape is intense, with pressures coming from both traditional insurers and new tech-driven competitors. Regulatory challenges in the insurance industry and the need for continual capital to fuel its aggressive growth strategy add to the company’s hurdles. These factors require careful navigation to maintain market relevance and operational stability.
Root Inc. Has a market capitalization of approximately $2.7 billion and employs around 900 people. The company’s revenue is primarily derived from premiums earned on its insurance policies, reflecting its core business operations.
Root’s stock has been highly volatile, reflecting the market’s ongoing reassessment of its long-term viability and profitability potential. Analysts’ views on Root are mixed, with some optimistic about its potential to disrupt the insurance industry, while others remain cautious due to its financial losses and the significant challenges it faces.
Root Inc. presents a unique case study in the intersection of technology and insurance and how disruption occurs. Its innovative approach to pricing based on actual driving behavior sets it apart in the crowded insurance market. However, achieving profitability, navigating regulatory landscapes, and continuing to innovate in a competitive environment are critical for Root’s sustained success and growth.
In this stock study, we will look at an analysis of the following indicators and metrics which are our guidelines, and which dictate our behavior in deciding whether to buy, sell or stand aside on a particular stock.
- Wall Street Analysts Ratings and Forecasts
- 52 Week High and Low Boundaries
- Best-Case/Worst-Case Analysis
- Vantagepoint A.I. Predictive Blue Line Indicator
- Neural Network Forecast (Machine Learning)
- VantagePoint A.I. Daily Range Forecast
- Intermarket Analysis
- Our Suggestion
While we make all our decisions based upon the artificial intelligence forecasts, we do look at the fundamentals briefly, just to understand the financial landscape that $ROOT is operating in.
Wall Street Analysts Forecasts
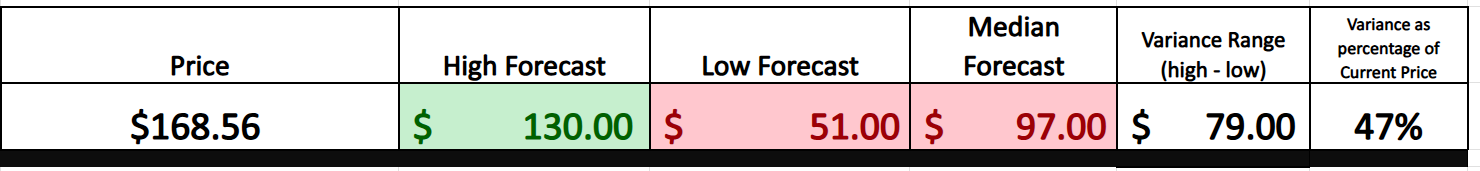
The first step of analyzing a trading or investment opportunity is to see what the top minds on Wall Street think about the stock. With $ROOT what is fascinating about this perspective is that ALL Wall Street Analysts have missed the mark. The current price is $168.56 and the highest forecast among top analysts is $130.00. This tells us what price has done, and is doing far exceeds the expectations of Wall Street’s elite analysts. A panel of six of Wall Street’s seasoned analysts have been scrutinizing Root’s stock over the recent quarter, and here’s where they’ve landed: they peg the average target price at $92.60. Now, while the more optimistic voices in the room project a lofty $130.00, there are those taking a more cautious stance with a lower threshold of $51.00. But here’s the kicker — this average target suggests a potential downside of a substantial 45.06% from its last closing price of $168.56. What a remarkable variance! We’re witnessing an intriguing intersection of analysis and market realities, one that offers a rich tapestry of insights and implications for investors.
When Wall Street’s finest analysts miss the mark, they will be forced to quickly upgrade their forecasts. But more importantly, we can see that the narrative that $ROOT has developed is that of a disruptor in the auto insurance niche and Wall Street is struggling to keep up with the disruption that $ROOT is creating.
Equally important is we look at the variance between the most bullish and most bearish forecasts to better understand expectations moving forward. Currently this variance is $79 and represents 47% of the current price. This level of expected volatility is high.
52 Week High and Low Boundaries
Check this out, traders — your trading map is all about that 52-week high-low range. It’s the heartbeat of a stock’s street cred. For the newbies and the old hands trading, this is the gold you need to dig up. It’s how you spot the titans from the jesters in the stock game.
When a stock’s dancing near its annual high, it’s shouting from the rooftops: “I’m the hot ticket in town!” The smart money’s piling in, confidence is skyrocketing, and maybe, just maybe, this is only the beginning. This is the stock making traders’ pulses race, the kind that coaxes open those tightly clasped wallets.
On the flip side, if a stock’s dragging its heels near that yearly low, throw up the caution tape. It’s a distress signal, maybe a slump hitting hard or it’s just plain out of favor.
Stocks cracking new highs can pull in tons more institutional participation, soaring even higher. But those that are tanking? They might just keep tumbling as folks bail out fast.
Keeping tabs on where a stock stands in that 52-week playground isn’t just a snapshot — it’s your compass for navigating the choppy waters of Wall Street. Nail this, and you’re not just playing the market — you’re owning it.
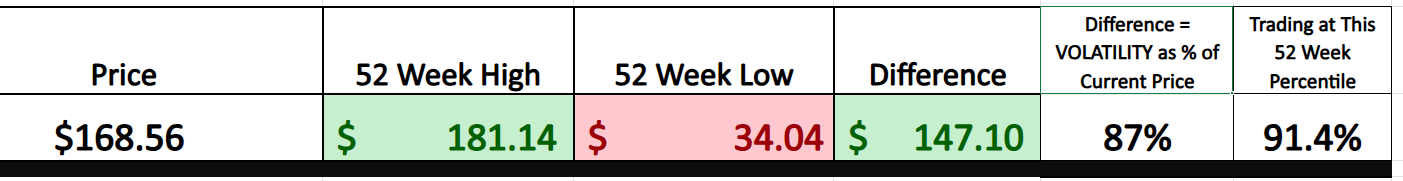
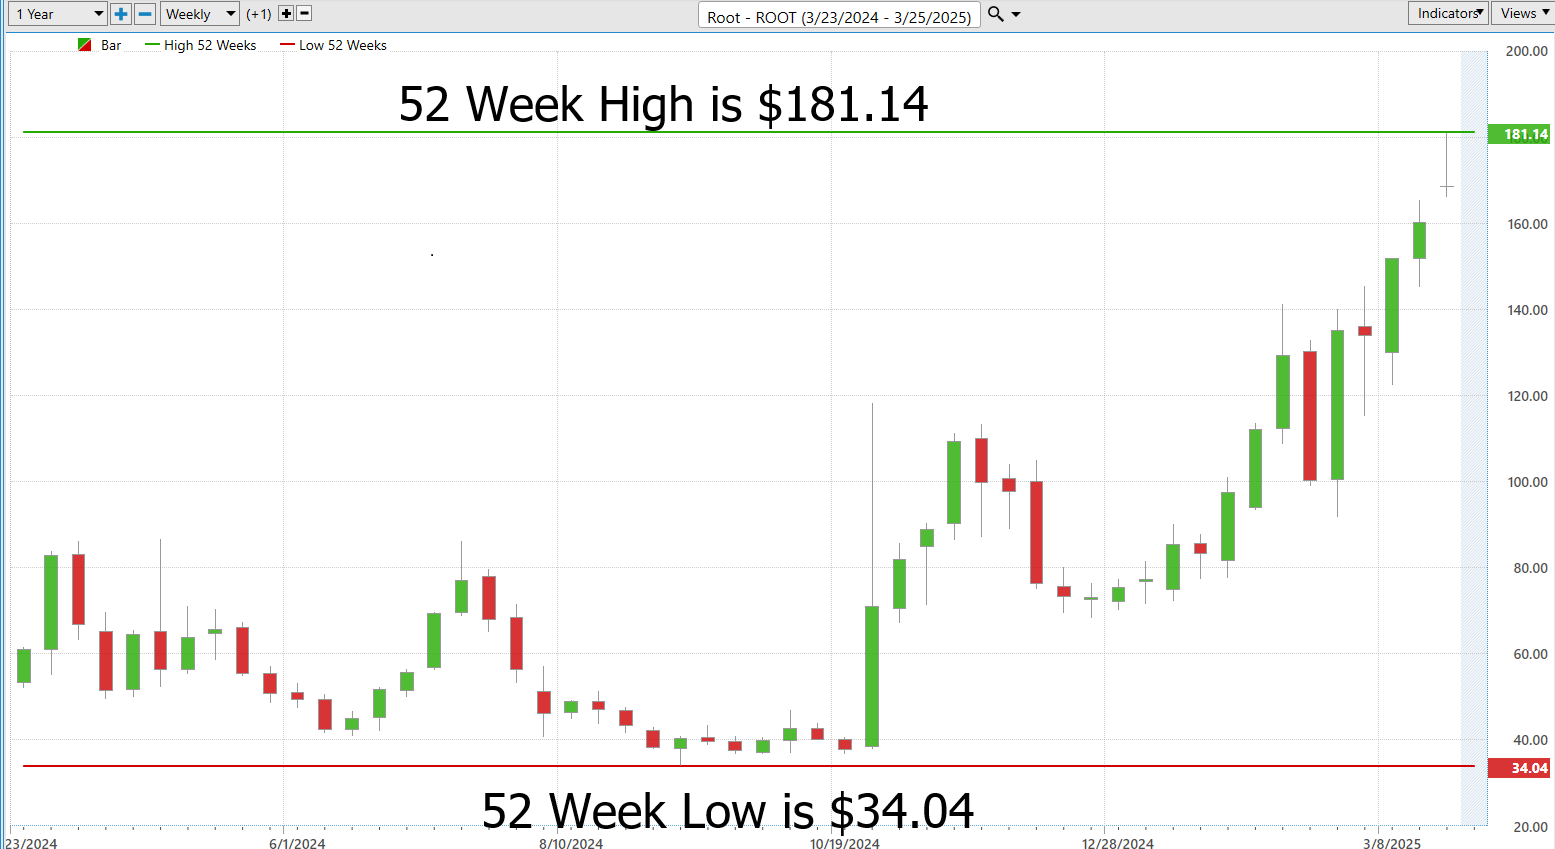
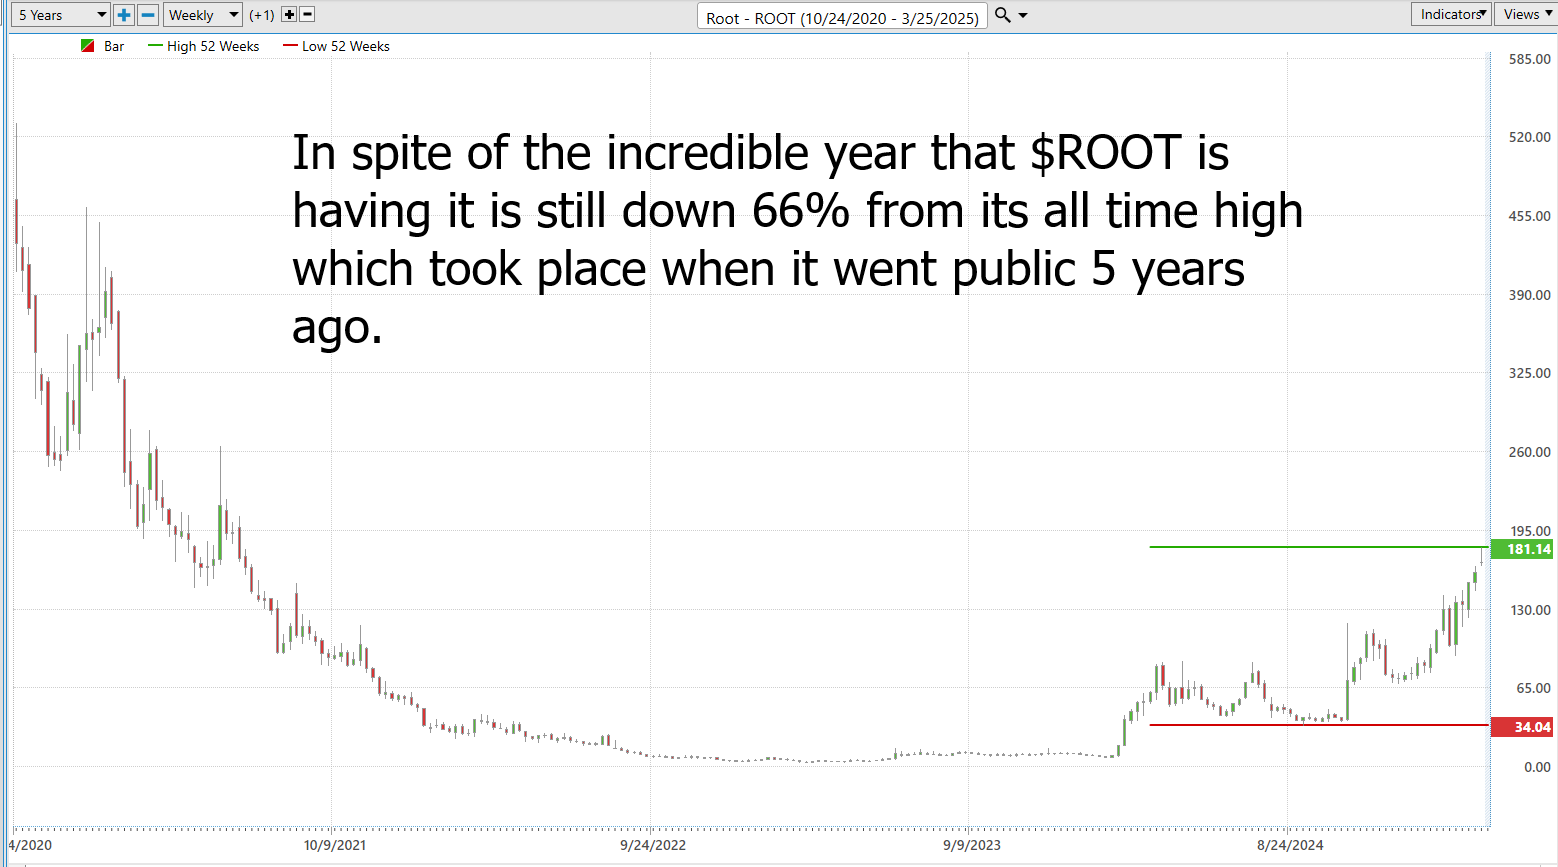
Over the past year $ROOT has traded as high as $181.14 and as low as $34.04. This is an incredibly wide range of $147.10 which represents 87% of the current price. The annual range is the historic volatility and tells us that if the future is like the recent past, we should buckle our seat belts and brace for large swings in terms of price action.
Here is a chart of the price action of the last 52 weeks:
We suggest that traders and investors zoom out from the 52-week chart to look at the price action over the longer term to get a clear idea of the trajectory that $ROOT has been on. Upon doing so, you will see that $ROOT is still down 66% from its all-time high price which took place shortly after the stock went public 5 years ago.
Best-Case/Worst-Case Analysis
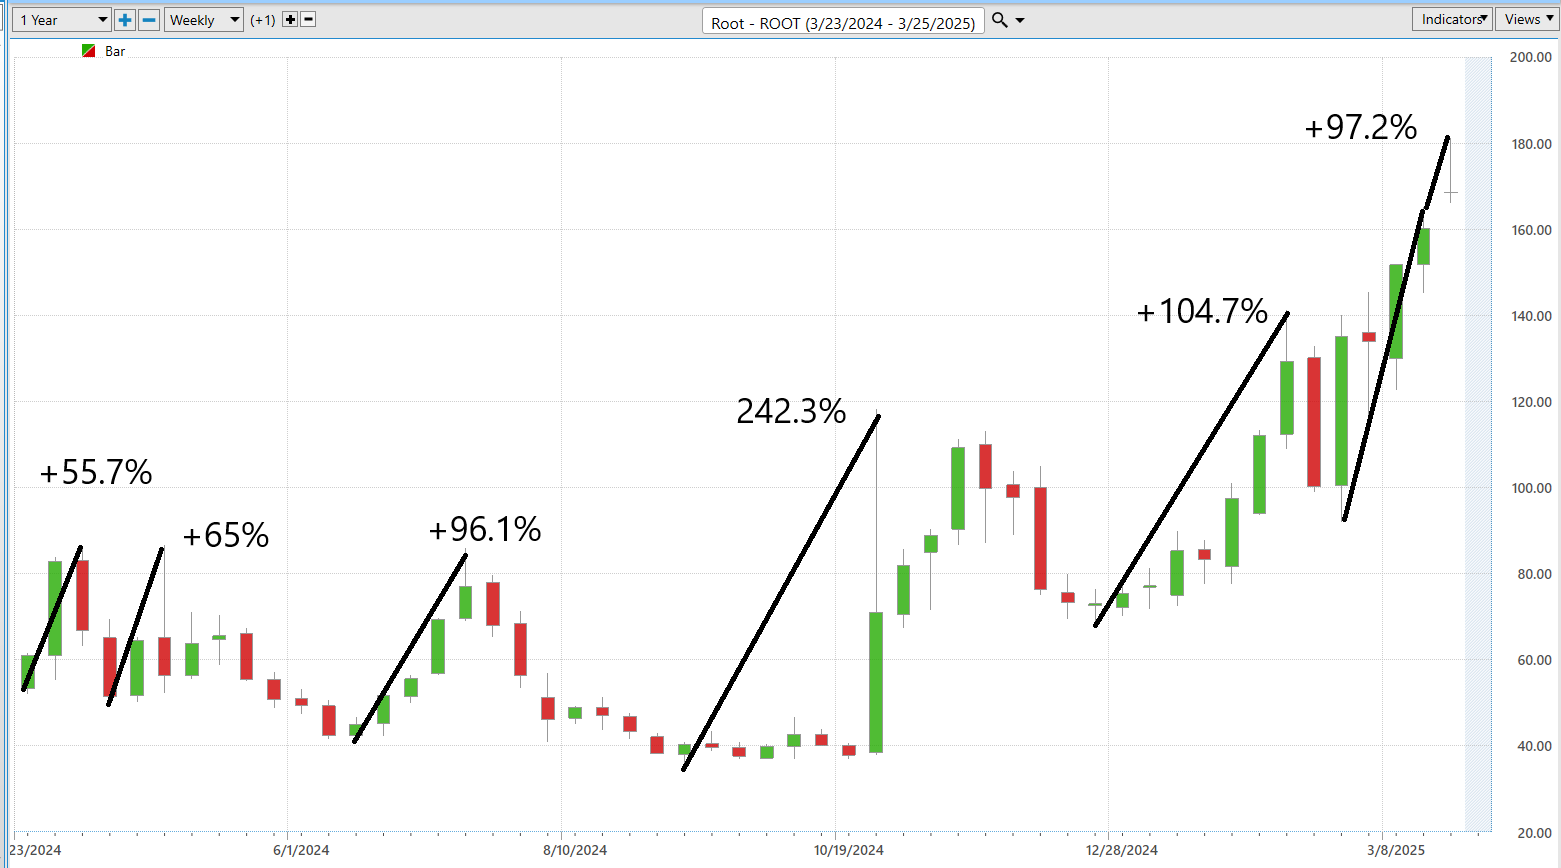
Before you jump into considering trading Root Insurance ($ROOT), it’s critical to thoroughly understand the potential risks and rewards. This is where scenario analysis proves its worth, especially for those considering investing in Root Insurance. An effective approach here involves comparing the magnitude and durations of Root’s stock rallies against its downturns. By charting these trends, traders get a clear visual of Root Insurance’s performance, offering a reliable basis for understanding volatility.
This analysis goes beyond just eyeing potential profits or losses; it sets realistic market expectations. For a company like Root Insurance, such insights can be revealing. Essentially, you end up with two distinct charts: one depicting the stock’s major upswings and another showing its sharpest declines. These visuals become invaluable tools, helping traders set smart stop-loss points and profit targets to avoid going into market battles unprepared.
These charts are more than just visuals; they transform into practical tools for crafting a trading strategy that’s grounded in hard data, not just guesswork. Recognizing these patterns enables traders to make more calculated, strategic decisions, aligning their actions with the market’s probable direction.
Now, let’s delve into the best-case scenario:
Followed by the worst-case scenario:
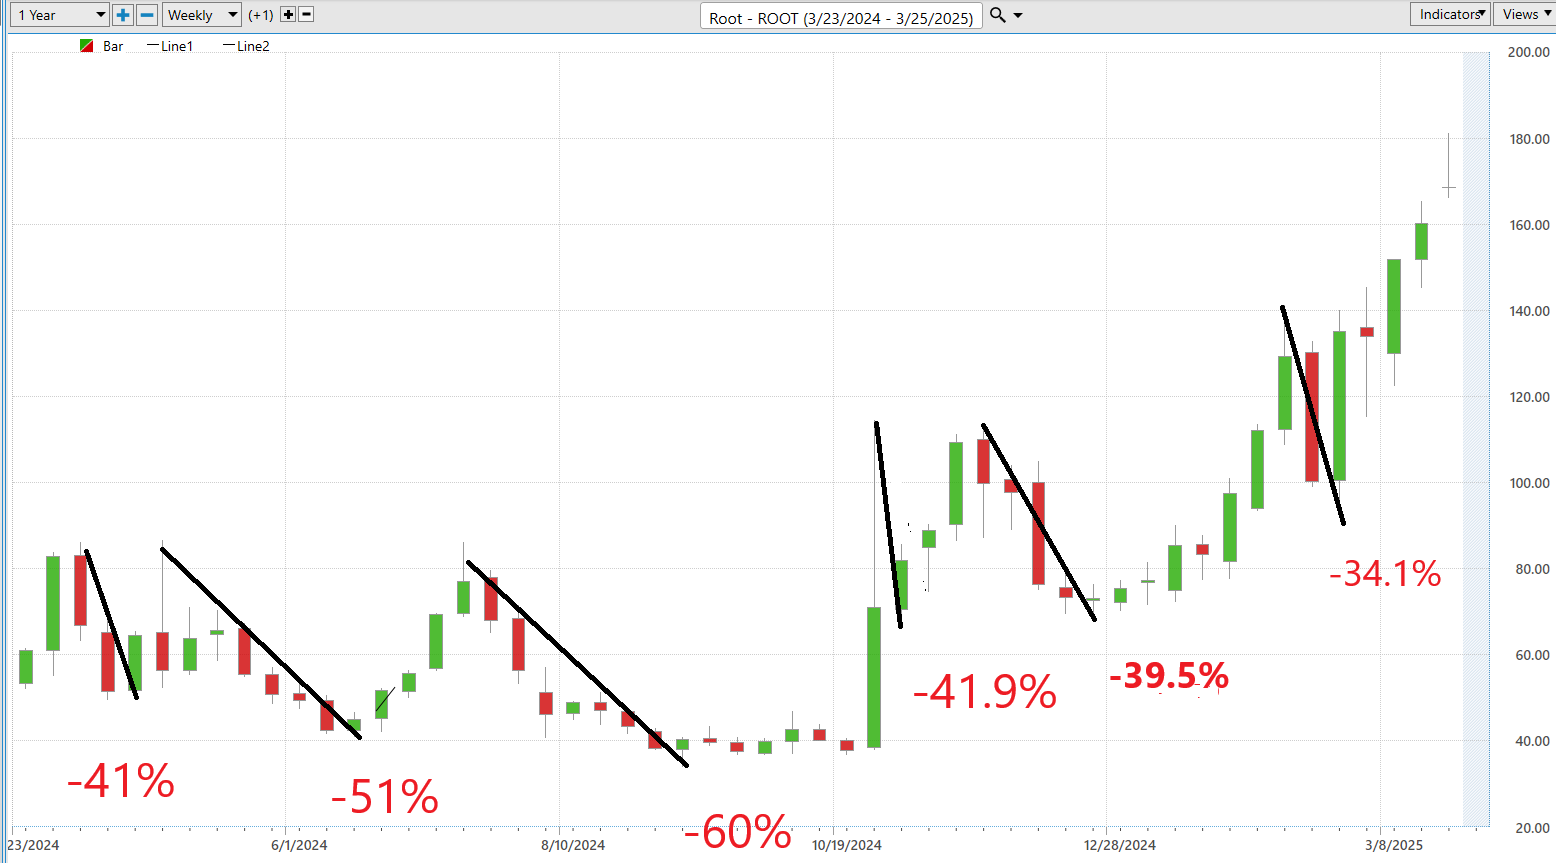
From these two charts we clearly can see the potential risks and rewards of trading $ROOT. The volatility is extremely high. By studying these two charts all traders will begin to appreciate the importance of position sizing and risk management. The largest uninterrupted decline was 60%, which occurred over a period of 9 weeks. The largest uninterrupted rally was 242.3% which occurred over 7 weeks.
Next, let’s pivot our focus to a comparative analysis between Root Insurance ($ROOT) and the broader stock market indices. This exploration spans multiple time frames, providing a layered understanding of how Root Insurance measures up against the market as a whole. Moreover, this comparison grants us essential insights into the stock’s volatility relative to the overall market, enhancing our grasp of its behavior across various market conditions.
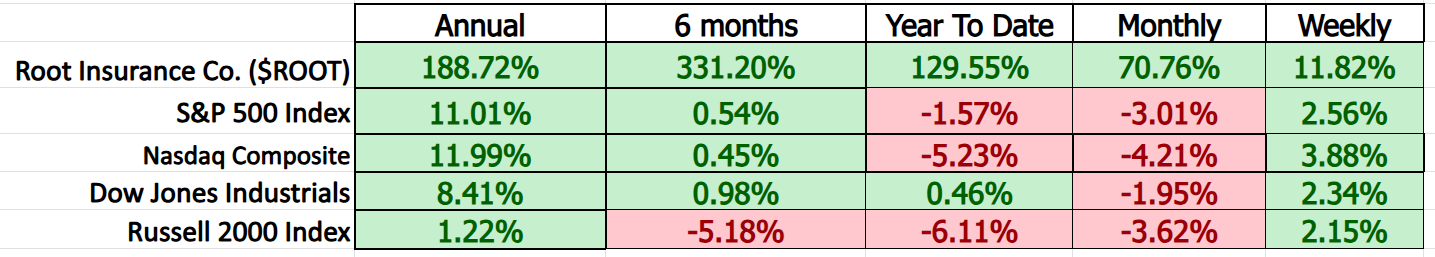
The bulls are clearly in control of $ROOT at the present. $ROOT has outperformed across all time frames.
The current beta for Root Insurance ($ROOT) is 2.49. This figure indicates that the stock’s price volatility is significantly higher than the market average. A beta value greater than 1 suggests that Root Insurance’s stock price is more volatile compared to the broader market. Essentially, if the market moves by 1%, Root’s stock is expected to move by approximately 2.49% in the same direction, implying higher risk and potentially higher reward.
Vantagepoint A.I. Predictive Blue Line

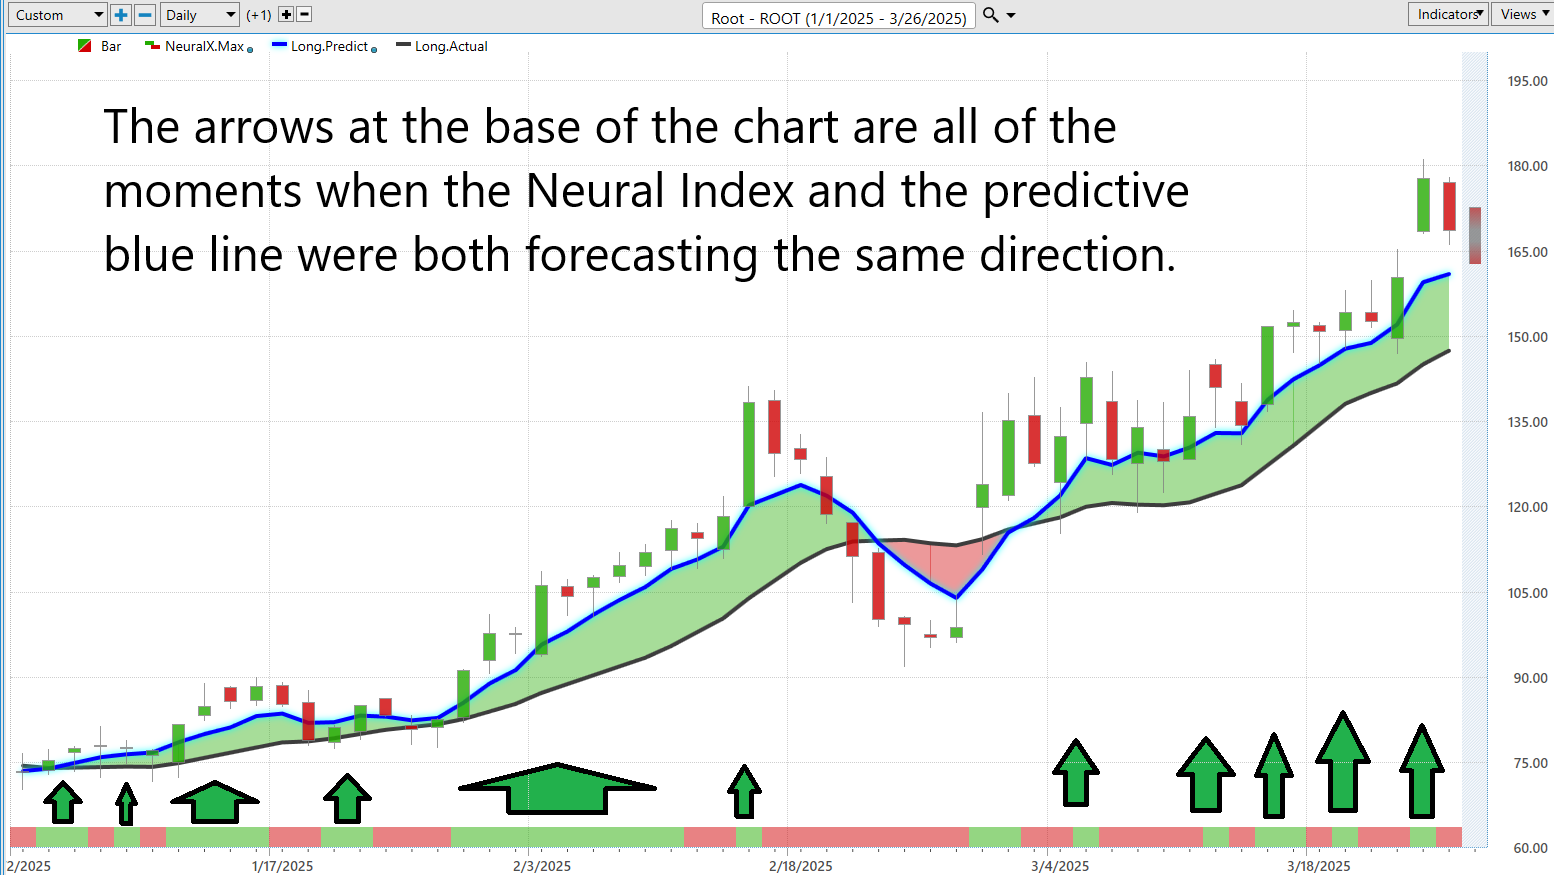
Imagine entering the trading fray with an ally that significantly enhances your competitive edge—this is the leverage provided by VantagePoint Software’s A.I.-driven forecasts, now tailored for Root Insurance ($ROOT). Think of it as a high-tech confidant in your corner. The software’s predictive blue line acts much like a sage advisor, steering your buy and sell decisions with extraordinary accuracy.
This predictive line transcends a mere graphical marker; it’s a strategic navigator through the tumultuous seas of stock trading. Here’s how to harness its power:
Interpreting the Slope: Analyze this line as the market’s mood ring. An ascending slope intimates a potential uptick in stock prices — signaling a time to look for buying opportunities. Conversely, a descending slope warns of potential price drops, cueing you to brace for possible sales.
Identifying the Value Zone: When Root Insurance’s stock price nears or dips below this predictive line during an upward trend, it’s a green light to buy. On the flip side, a stock price that hovers above this line during a downward trend advises caution.
Recognizing Downward Warnings: A consistent downward trend in the blue line is a crucial indicator to safeguard your investments, much like recognizing impending storm clouds.
Utilizing VantagePoint’s A.I. transforms each trading decision from mere speculation to a carefully calculated move, distilling complex market data into clear, actionable insights. This approach is about making well-informed, strategic decisions that set you up for success.
Note how there have been three recent A.I. trend forecasts. Two have been potentially profitable, cranking out gains of 49% and 36.5% respectively. The ‘losing’ trade scenario registered a 7% loss.
This isn’t just about using technology; it’s about strategically deploying it to forge a path to trading success.

What is impressive about this rally is that it occurred while the rest of the market was in complete freefall. Whenever you see a stock that is moving counter to the broader market, we advise you to place that asset on your trading radar and watch it closely. It is worth more investigation.
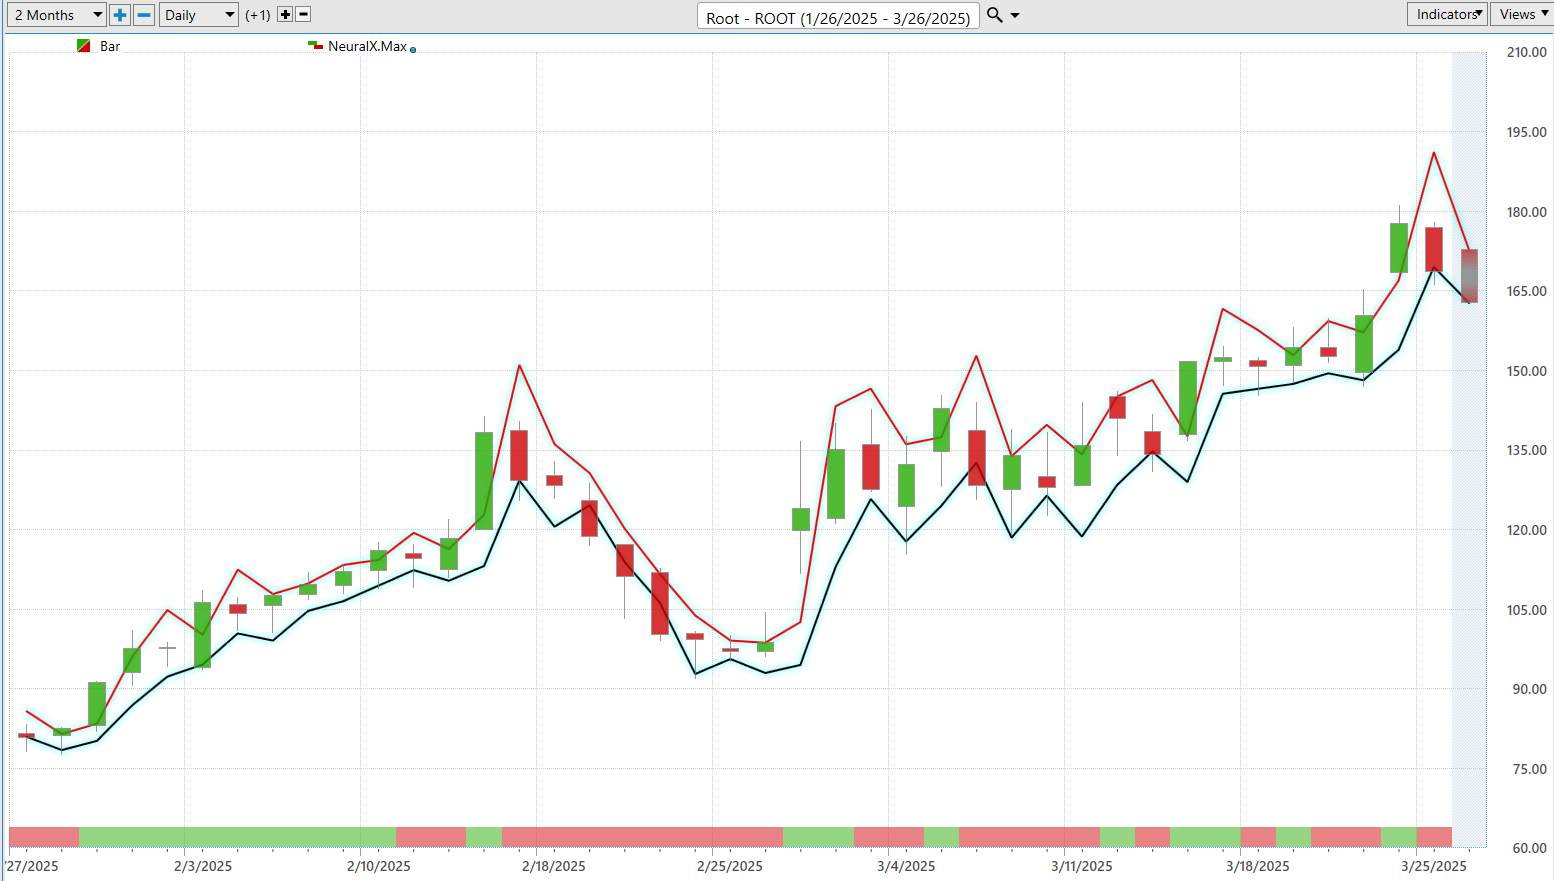
Neural Network Forecast (Machine Learning)
Neural networks represent a cornerstone of modern artificial intelligence, much like the intricate neural pathways of the human brain that decipher patterns and solve complex problems. In the high-stakes world of financial trading, these networks power sophisticated A.I. systems, including the neural index — a pivotal tool for traders. This technology sifts through vast troves of market data to forecast short-term stock movements, usually over one to three days, offering traders a significant edge by augmenting decision-making with data-driven insights.
Positioned discreetly at the bottom of a trading chart, the neural index signals market conditions with simple color-coded alerts: green indicates strength and potential for growth, while red warns of an impending pullback. Envision the neural network as a hyper-intelligent assistant for traders, rapidly analyzing data to recommend optimal buying or selling moments. This digital savant leverages historical data to bypass emotional biases and deliver precise predictions, thus enabling traders to navigate market volatility with confidence and strategic foresight.
In essence, traders equipped with neural networks transform their approach from reliance on instinct to strategies grounded in robust analytical predictions, ensuring decisions are informed, timely, and sharply tuned to the rhythms of the market. This fusion of technology and trading acumen not only enhances the precision of trades but also redefines the landscape of financial investment by merging human intuition with the formidable power of A.I..
VantagePoint A.I. Daily Range Forecast
The Vantagepoint A.I. Daily Range Forecast for Root Insurance ($ROOT) has evolved far beyond a mere analytical tool, emerging as a pivotal asset in any trader’s arsenal. This cutting-edge technology enhances decision-making by pinpointing optimal times to initiate or conclude trades — a critical advantage in the rapid-fire realm of financial markets.
The volatility of today’s markets demands that raw data be elevated into actionable insights. Here, the full capabilities of artificial intelligence, machine learning, and neural networks come to the forefront, slicing through market clutter to deliver precise, actionable forecasts.
Now, let’s examine the average trading ranges for $ROOT over the past year across daily, weekly, and monthly time frames:
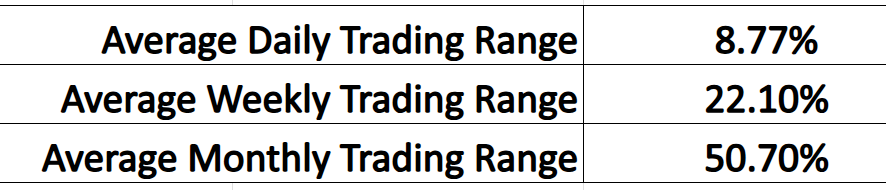
This analysis provides another perspective on volatility and highlights how wide the trading ranges over each time frame are.
The Vantagepoint A.I. Daily Range Forecast is cutting through the market’s unpredictability with astonishing precision, delivering daily trading insights that keep traders a step ahead of rapid market shifts. This isn’t just about digesting vast amounts of data; it’s about converting that data into actionable intelligence. This tool doesn’t merely assist — it equips traders with the foresight of a seasoned strategist, transforming raw data into a formidable tactical edge in the financial battlegrounds.
Intermarket Analysis
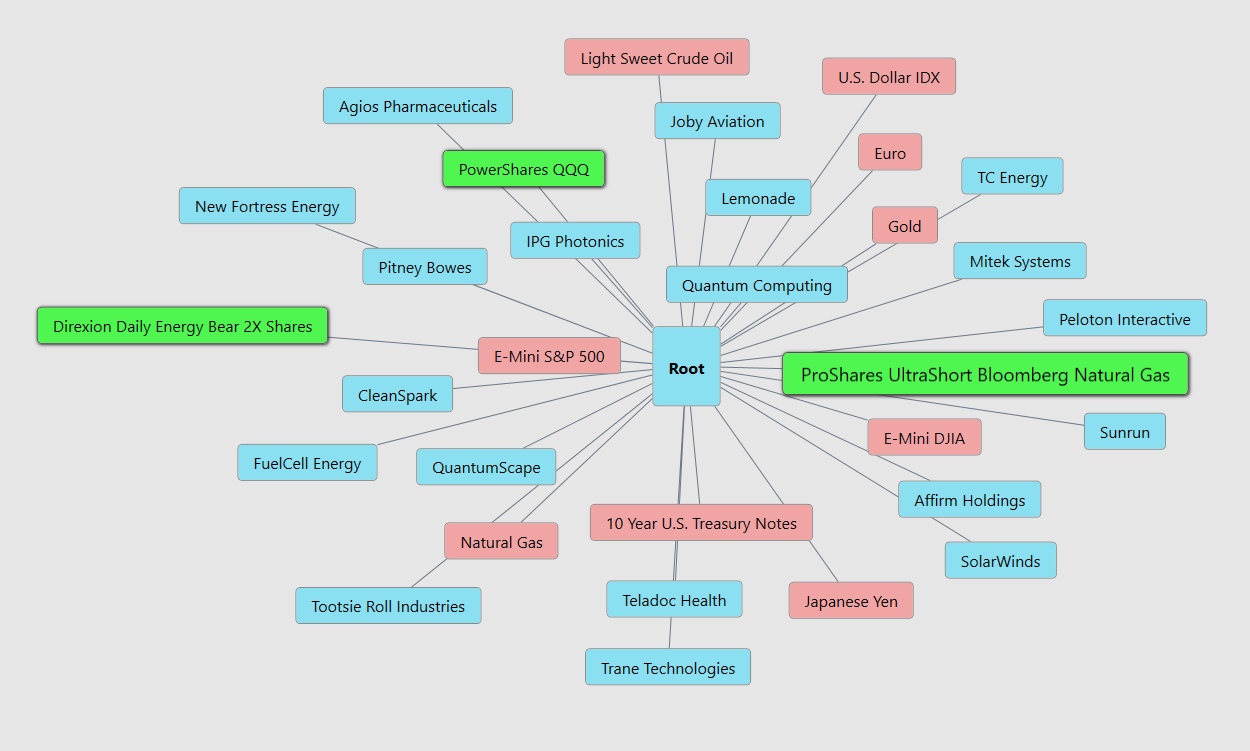
Intermarket analysis is a trading strategy that evaluates the relationships between different financial markets to make more informed trading decisions. This approach is based on the idea that all markets are interconnected; movements in one market can influence others. Traders utilize this analysis to understand correlations between stocks, bonds, commodities, and currencies, which can help in managing portfolio risk, making strategic trading decisions, and improving diversification. For example, a rising commodities market may indicate inflationary pressures that could lead to falling bond prices and potentially impact stocks. By understanding these relationships, traders can anticipate market movements and adjust their strategies accordingly, potentially reducing losses and capitalizing on opportunities across different asset classes.
An intermarket analysis of $ROOT (Root, Inc.), reveals that its stock price is influenced by broader equity market trends, particularly within the tech and financial sectors, as well as interest rate movements. Key drivers include the performance of the S&P 500, with which $ROOT shares a positive correlation due to its tech-driven business model, and rising interest rates, which can negatively impact growth stocks like $ROOT by increasing borrowing costs and reducing investor appetite for riskier assets. Additionally, commodity prices, such as oil, indirectly affect $ROOT’s stock through their impact on insurance claims costs (e.g., auto repairs), while a stronger U.S. dollar could pressure profitability by tightening consumer spending on insurance products. Recent results suggest $ROOT’s stock is sensitive to macroeconomic shifts, with correlations to bond yields (inverse) and tech sector indices (positive) playing significant roles in its price dynamics.
Our Suggestion
Root Inc. is dramatically reshaping the insurance landscape, and its performance in the latter half of 2024 encapsulates its ambitious trajectory. The firm’s recent earnings call for the third and fourth quarters reveal a company that’s not just surviving but thriving, having secured its first full year of net income profitability of $29 million. Impressively, policies in force have grown by 21% year-over-year, a testament to its advanced telematics and data-driven platform that’s increasingly setting it apart from more established players.
Root’s strategy includes aggressive expansion through partnerships and geographic reach, aiming to provide coverage for an ever-wider audience across the U.S. This expansion is backed by a savvy financial maneuver — a 50% reduction in interest expenses anticipated for 2025, courtesy of a debt refinancing deal with BlackRock. However, the road ahead is not devoid of obstacles. Furthermore, the fiercely competitive market necessitates keen pricing strategies to maintain its competitive edge. Root’s narrative is far from mundane; it’s a dynamic entity in a high-stakes arena, navigating complexities with a clear, aggressive strategy. $ROOT appears to be disrupting the entire auto insurance niche.
The next earnings call is scheduled for April 29, 2025, after the market closes. Analysts will be looking for continued revenue and earnings growth to verify that $ROOT has long term traction.
$ROOT deserves to be on your watchlist and trading radar. Because of its massive volatility it will create numerous trading opportunities in the months ahead.
Use VantagePoint’s A.I. Daily Range Forecast for short term trading guidance.
Practice good money management on all your trades.
It’s not magic
It’s machine learning.
Let’s Be Careful Out There!
Disclaimer: THERE IS A HIGH DEGREE OF RISK INVOLVED IN TRADING. IT IS NOT PRUDENT OR ADVISABLE TO MAKE TRADING DECISIONS THAT ARE BEYOND YOUR FINANCIAL MEANS OR INVOLVE TRADING CAPITAL THAT YOU ARE NOT WILLING AND CAPABLE OF LOSING.
VANTAGEPOINT’S MARKETING CAMPAIGNS, OF ANY KIND, DO NOT CONSTITUTE TRADING ADVICE OR AN ENDORSEMENT OR RECOMMENDATION BY VANTAGEPOINT AI OR ANY ASSOCIATED AFFILIATES OF ANY TRADING METHODS, PROGRAMS, SYSTEMS OR ROUTINES. VANTAGEPOINT’S PERSONNEL ARE NOT LICENSED BROKERS OR ADVISORS AND DO NOT OFFER TRADING ADVICE.