Talking Points
- Gold Prices Range for the 9th Consecutive Session
- Daily Resistance for Gold Prices is Found at $1355.00
- Get the latest analysis on Gold prices with our Q3 Gold Trading Guide .
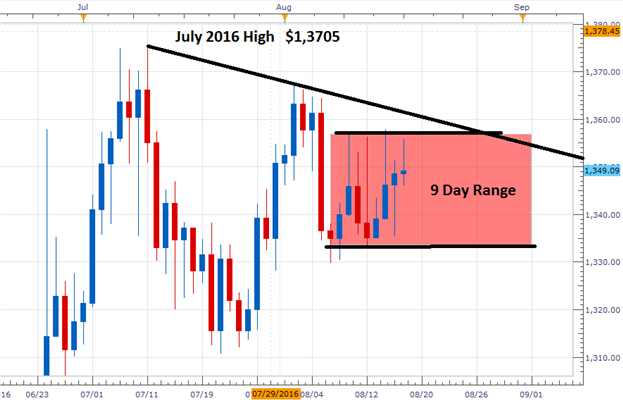
Gold prices continue to range for the 9th consecutive trading session, as the commodity fails to hold over critical resistance at $1,355.00. With price being rejected here, gold prices may return back towards daily support near $1,335.00. This range is ultimate a part of a broader consolidating pattern, with the price of gold failing to make significant highs since July's peak of $1,3705.04.
Gold Price (Ticker:XAU/ USD ) Daily Chart
Traders watching for a bullish breakout from this range should continue to monitor the R4 Camarilla pivot, found at $1,357.44. If the price of Gold trades above this point of intraday resistance it opens the commodity up to test the current August swing high at $1367.15. Alternatively if Gold stays inside of today's trading range, traders may begin looking for intraday support near $1,344.15 Bearish breakouts on the day may begin under the S4 pivot at $1,339.73. If the price of Gold breaches this point, it would then open up price action to test the previously mentioned value of range support.
Gold Price (Ticker:XAU/USD) 30 Minute
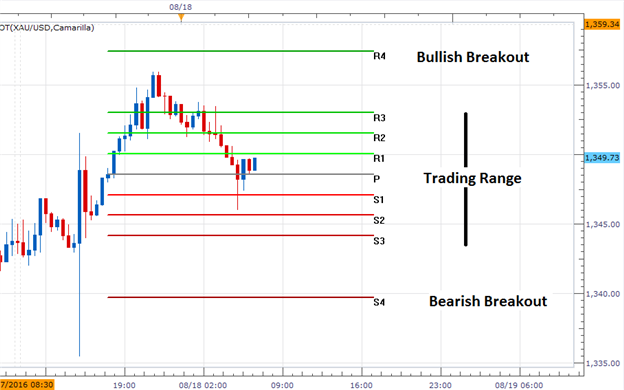
(Created by Walker England)
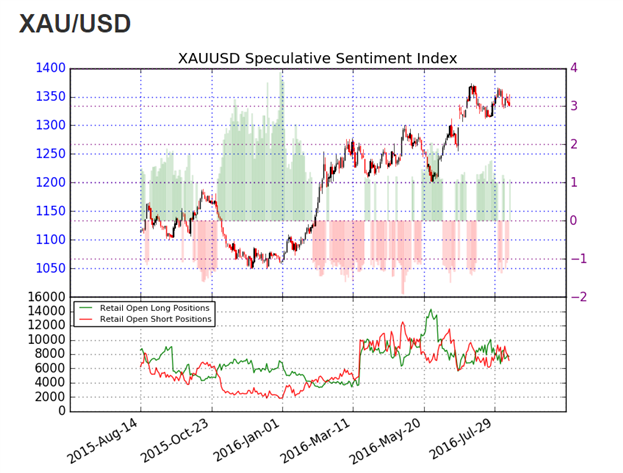
The ratio of long to short positions for Gold (Ticker: XAU/USD) stands at +1.08. This SSI (speculative sentiment index) reading shows that 52% of positioning is currently long. Typically, a neutral reading in SSI is indicative of consolidating or ranging markets. If prices continue to range, it would be expected for SSI to continue reading at neutral values.
To Receive Walkers' analysis directly via email, please SIGN UP HERE
See Walker's most recent articles at his Bio Page .
Contact and Follow Walker on Twitter @WEnglandFX.